Stock Market Movement
Trader Bob’s Theory of Stock Market Movement
 The Rule of the Screw By Robert Buran aka Trader Bob
Markets must move in such a manner so as to Frustrate, undermine and defeat the best interests of the majority of market players (Translate: “The Rule of the Screw”). According to this rule of stock market movement the majority cannot make money in the
 marketplace. The markets will totally ignore technical indicators and fundamentals if the majority of the market players act on those technical indicators and fundamentals.
Price movement is predominantly random, not 100 percent random, but predominantly random. The “secret” to making money in the market is locating that small portion of market behavior which is not random and exploiting it. I do not feel that conventional technical analysis is of any value in doing this. The problem with technical analysis is that it will present the illusion of uncovering hidden relationships between price behavior and various indicators.
I would submit that all such indicators are as random as the price behavior they attempt to predict and that all profits and losses realized from trading such indicators will be randomly distributed.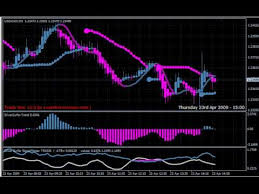
Technical analysis is pseudo science.
Isaac Newton and the Market Place:
In place of technical analysis I prefer something I call market momentum theory. For more details see my article, Stock Trading for Dummies.
- First law of price movement is:
If prices move up there is greater probability they will move higher rather than lower.
- Second law of price movement is:
If prices move down there is greater probability that they will move lower rather than higher.
And from these simple rules comes the most important rule of trading:
- If price goes up you must buy the market and if price goes down you must sell the market.
You may read this and think “well so what?, that is obvious”. But trust me most traders and trader wannabes do not think that way at all. When the market goes down they want to buy to get a better price. And when the market goes up they hesitate because price is too high.
And they do not make money! They are a part of the losing majority.
Let us look at the following chart:

This is exactly what system venders show in ads. They show that their system buys the lows and sells the highs. But that is a fantasy and it cannot be done. Yet some smart traders see this and they buy the system because it shows traders what they want to believe. Even smart traders can get sucked into this kind of thinking.
The problem is that when we look at any chart we want to buy low and sell high. You cannot, however, buy bottoms and sell tops. You can only follow a trend which has already been established through price movement in the same direction as the position you are taking.
You must understand that when you elect to buy a market when price rises you are in effect buying the market at the worst possible price at the time of your entry. It’s not going to feel good and it’s not going to look good on the charts. But by “buying high” you are probably going to be placing yourself on the minority side of the market and therefore assuring yourself of profits.
Exiting a Position
Getting out of a position is just as critical as getting in. In my opinion most of the popular ideas for getting out do not work. Let us look at just two of those ideas, the stop and reverse method and the trailing stop method.
Stop and Reverse method of exiting a trade: The stop and reverse method involves utilizing some kind of indicator or a price based on an indicator. If the system is long one contract and the market comes back and the price is hit the system sells 2 contracts and reverses to a short position and so on. If you have read much of my material you know I do not like to short the stock market.
Of all possible trading strategies I have found this to be the least profitable and grossly inefficient with respect to the use of margin money. I will discuss margin efficiency in greater detail later but for now it need only be said that systems that are in the market all the time tie up your margin needlessly (see my article, Hit and Run Trading). Markets tend to move sideways about 85% of the time and consequently these systems will have your margin money tied up doing absolutely nothing for at least 85% of the time. These systems can also whipsaw you to death while moving sideways.
A system like Jordi’s Intra-Day2 is, by contrast, very margin efficient. It gets into a market only when a given market starts significant movement and it is usually out of the trade the following day. “Jordi” does not tie up your margin money.
Trailing Stop:
The second most common way mechanical systems take profits is through the use of a “trailing stop.” The idea behind a trailing stop is that it allows you to “let your profits run” while at the same time “locking in” any profits you may have already made. My experience with system design and trailing stops has been that the trailing stop is at best a mediocre method of exiting a profitable position. The problem is that if the trailing stop is too tight it results in your having your stop tagged right before the start of a big move. Conversely if your stop is too deep it results in many small profits going to large losses.
The other problem I have with trailing stops is more theoretical. With a trailing stop you are trying to take profits only after the market has turned against you. Frequently you are forced to sell out your long position when many others are trying to sell too. You are then moving with the crowd and this is almost inevitably going to cause you excessive losses.
Therefore the rule I have developed with regard to taking profits is:
You should try to take profits only when the market is moving strongly in your favor.
This is much more consistent with my contrary philosophy of trading. If you are long a market and the market takes off like a space ship you should sell. By doing so you put yourself on the minority side of the market selling to the majority of panicked buyers. That is how you make money in this game.
What should you do, however, if your position starts out bad, get worse and then threatens an uncontrolled hemorrhage of your account equity?
Unfortunately this happens with about 15 or 20% of our trades and our ability to keep these losses within a normal distribution pattern is what makes or breaks us as traders. This is a particularly critical issue if you are using Systems without stops on day of entry.
Out of frustration I developed a simple strategy that probably works better than anything I ever developed. If you are sick of always having your stops run, this simple strategy is going to be a big help. If you got into a trade based on a longer time frame such as a time frame based on daily data you need to develop a stop loss strategy that is based on a shorter time frame.
This is why Jordi’s Intra-Day2 is an improvement over my previous systems using only daily data. Jordi uses two data streams, daily data and 15 minute bar data.
To see how looking at two different data streams can improve our analysis you should kick up a chart on your computer screen and set the bars to something like 3 to 10 minutes. If you are following our trading rules you are going to buy when the market goes up. This upward movement should create some kind of upward wave on the intra-day chart. You should measure this wave from its top to its bottom and if you are long the market you should place your stop at the point that represents a 75% retracement of that wave. If you are short the market you simply reverse the process. Hence my rule for placing your protective stop is:
Place your protective stop at a point that represents a 75% retracement (5/8 or 6/8) of the wave/move that got you in.
Let’s look at an illustration (click to enlarge):

Here again you see why the “buying high” strategy doesn’t sell systems. Buying point B (which is the high) looks like a terrible place to enter this market. Why not sell at point B? Or if we have to go long why didn’t we buy at point L (which is the low)? Don’t despair.
Because you feel that way others will feel that way also and so they, the majority of market players, won’t buy because it’s too scary. The market in the best tradition of the “Rule of the Screw” will sense this hesitation by the timid majority and move much higher. That will encourage the timid majority and they will then jump into this market in a buying frenzy.
At that time you will calmly sell your positions back to the frenzied majority and take your profits. The whole scenario looks something like this (click to enlarge):

The point I’m making is that when you first get into these trades they seldom look good and you need to use the 75% retracement rule to place a stop so as to give yourself some peace of mind. If you go back and look at Figure 2 you can see how this stop was calculated. I measure from point L (low) to point H (high) and take 75% of that and subtract that from point H to determine the stop which is equivalent to the price shown at point SS (sell stop).
If you are an Elliot Wave purist you may notice that there are other smaller waves in figure
Try to keep it simple and try not to miss seeing the forest for the trees. I’m not an Elliot Wave purist and what I do with a 3 to 10 minute chart is to measure from the highest high after your buy point has been hit to the lowest low on the screen.
Usually that is going to be the lowest low in the last day or two. That’s what I mean by “the wave that got you in.”
The Fibonacci Connection
Some of you sharper readers may at this point notice that maybe I might really just be playing around with Fibonacci ratios. Indeed what we are really saying when we elect to place a stop at “75% retracement of the wave that got you in” is that if the market fails to be supported at the 5/8 or .618 Fibonacci retracement point, it becomes a “Fibonacci failure,” a trend reversal and we need to get out of the way of a collapsing market.
Believe me you are going to be very happy to be out of the market if these stops are hit and it will be very unusual for the market to “tag” these stops and then move higher. This is the most effective stop loss strategy we use.
Some of you technical analysts may at this point feel somewhat vindicated. Here I am telling you first that technical analysis is a lot of baloney and then I turn right around and start using Fibonacci ratios for stop placement.
Of course the ratio .618 wasn’t invented by a technical analyst. It was known to ancient Greek and Egyptian mathematicians as the Golden Ratio or the Golden Mean and was used in the construction of the Parthenon and the Great Pyramid of Gizeh.
Summary and Conclusions
These “laws” (If Prices move up there is greater probability they will move higher rather than lower; If prices move down there is greater probability that they will move lower rather than higher) are permanent, will not break down and cannot change in the future.
Once we have entered a trade based on these rules we will reject traditional “stop and reverse” and “trailing stop” strategies of exiting our trade. Instead we will:
Take profits only when the market is moving strongly in our favor and place our protective stop at 75% retracement of the wave that got us in.
Some of you may at this point be ready to reject these market theories as being far too simple to be useful. Before you toss these ideas in the trash, however, I want you to look below and see at my equity curve for the past seven years. Look at the summary of my monthly profits from January 1, 1989 when I became fully automated, through June, 1991. Look at the consistent income and small draw downs.
How many gurus do you know who have included seven years of real-time trading records along with the materials they are selling?
I learned these rules in the marketplace and while attending the “School of Hard Knocks.” On the surface they may seem simple, but implementing them in the marketplace is a more complicated process.
You can integrate these ideas perfectly into your short term stock trading. Later I will show you how you can consistently gain an edge on the stock market and automate a stock market trading system using these same simple rules. Using these strategies and rules of stock market movement you need not fear that these basic rules will break down or stop working. They can’t stop working anymore than Newton’s Law of Gravity can stop working.
Consider reviewing my market momentum theory in the article, Stock Trading for Dummies.
I believe if we stop looking at all those wiggly lines, stock market charts and complicated formulas and concentrate instead on simple up and down price movement we can beat the pants off the big boys. Call this back-to-the-basics trading or call it anything you like. I call it financial security: CLICK IMAGES TO ENLARGE:


