Monday September 25, 2015
Dow opens – 143 and our open trade sinks.
Market Open (click to enlarge)
The Dow closes – 312 This is what we closed out: PRLB -2165, RMBS – 360
Total = -$2,525
This is what we are holding: (click to enlarge)
The Dow closes +113 This is what we closed out: DL +800, CCIH -420, DDD -1120, PRLB +540, AFOP -270, SBGL -900, JUNO +4557, VBLT +8136
Total = +$11,323
This is what we are holding: (click to enlarge)

Stock trading record keeping is perhaps the most boring of topics we discuss. Nobody is interested record keeping. When I was researching key words for this article I found there were 28 searches per month for “Stock trading record keeping” but 6,600 searches for “stock trading tips”. So this is my stock trading tip for you the reader: You will not make one dime trading markets unless you learn good record keeping habits. Please continue to read.

Record keeping is possibly the most important topic to understand for the wannabe trader. Without good record keeping a trader is going to be drifting and lost on a sea of confusion. Without record keeping the new trader is unable to measure his progress and he will simply flit from one trade to another with no understanding of the process. Without learning this any new trader is doomed to failure.
By now you may have grasped that one of the most critical skills you must learn to make this methodology work relates to your skills at order execution. This is not a passive approach to trading, but rather one that puts you in front of one or more computers every trading day and requires you learn to get into and out of markets at the best price possible while at the same time observing the most sacred of all our trading rules: “YOU MUST TAKE ALL THE TRADES”.
And so at the end of the day, assuming you have taken all trades, you will have a bunch of numbers representing prices the system got into trades and prices that represent the actual prices of the orders you executed.
This is what my real time orders for one of my managed accounts looked like at the end of the day on 9/15/2015 (click to enlarge):

How these numbers line up determine not only what your profits are, but they determine how you as a trader are doing in learning these critical skills. Without good stock trading record keeping you are not going to have a clue regarding how you are developing as a trader. But I also believe that if you fail to keep good records you will soon lose interest and lose faith and become a kind of “trader drop out”. You should not let this happen. You can, with persistence and patience, earn a lot of money doing this and keeping good records will help you stick with the system through thick and thin.
Your main tool for keeping records is a spread sheet program. I include with this article the exact spread sheet I use every day. You can download it for free. There is a small amount of data included so you can see what I am doing. The “bottom line” for this sample spread sheet is all the way down at line 500. But you can move the “bottom line” up and down if you like. The red columns are for shorting even though I presently do not short stocks.
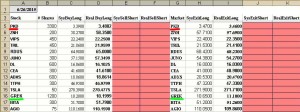
So in order to keep things simple and understandable let us go through the process of entering one day of trading in June 2015. This is from one of my managed accounts and represents real time trading with about a $250,000 cash account. In these examples I am putting up about $10,000 to $20,000 per trade (click image to enlarge).

Filling out this sheet is simple. For example let us take the first stock PKD. After listing the name of the stock we enter the number of shares bought (3500). Then in column C we enter the exact price the system bought at (3.39). Then in column D we enter the exact price that we actually bought the stock at (3.48). Then in Column H we record the exit sell for the system (3.47) and then in column I the actual exit price (3.46). This is an example of negative slippage.
Next I am showing you GREK which is an example of positive slippage. First we show the number of shares (1200), in column C then we show the system buy (10.2) and in Column D the real time buy (10.1999). Then for exits in column H we record the system exit as 10.65 and in column I 11.10 for the real time exit.
The spreadsheet program will do the remaining calculations. Lets move the spreadsheet over to see the remaining columns: (click image to enlarge)
For PKD this shows in column L that the system made $264 but in real time, column M, we lost $66 (negative slippage). But in GREK we had positive slippage. Column L shows the system made $540 but in column M we see that in real time we made $1,080. All the slippage numbers can be seen in column P. The negative slippage of PKD shows (330) and the positive slippage of GREK is shown as 540 without parenthesis.
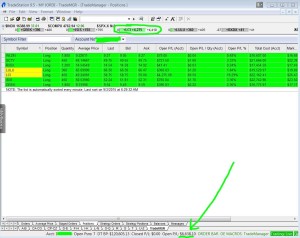
If you place resting orders with a broker or trade with full automation you will “trade perfectly without mistakes” but you will almost always experience some negative slippage. In 2015 I like to do all my entries with resting orders in order to avoid missing trades. But sometimes I like to exit early when big profits are showing. That is what I did with the above GREK trade in June 2015. Another time in September 2015 I got out early when “everything was green” and there were exceptional profits in one stock. I do not do this often and I only do it when there are exceptional profits to be made. But one only needs to do this right a few times in order to offset all the slippage that comes from normal mechanical trading. This is a screen shot from that September 2015 day that made me nearly $3,000 in positive slippage. Be sure to click this image to enlarge it: (click image to enlarge)

That is why I like to combine strict mechanical trading with “pajama trading”. Please see my article, The Subtle Art of Manual Trading. With this combination of mechanical trading and pajama trading it is possible to trade at close to zero slippage and that means we can pile up large profits with a lot of small trades and that means we can limit disaster trades and large draw downs.
But combining mechanical trading with Pajama trading is not for everybody. You must have the time to be free 6 and one half hours every market day to sit in front of those computers. You should find watching markets interesting and it should not cause you undue stress.
What if I miss a trade? What if I accidentally take a trade I should not have? How do I enter these mistakes into the spread sheet? Answer: You should avoid mistakes if at all possible, but if it happens, you must enter the trades and the numbers for the system into the spread sheet. To illustrate look at the following: (click image to enlarge)
The first three marked stocks, RDUS, GREK, and CCIH, are all trades that were missed. To record these missed trades the system buy and sells are recorded. But the real time buy and sells are recorded as 1.000. This causes the real time trades to show zero dollars for profits or loss. As a result RDUS and GREK show negative slippage because the system made money but we missed the trades. On the other hand CCIH lost money in the system and so it is shown as positive slippage being as we did not take the trade and therefore did not lose the money that the system did.
The last marked stock, SFUN, illustrates how to record a trade that was taken accidentally. In this case we accidentally doubled up because we had two charts for SFUN open. In this case we record 1.000 for the system entry and exit so the system shows no profit or loss for this trade. In this case the mistake cost us money and therefore we show (162), negative slippage, for the mistaken SFUN trade.
So If you missed a winning trade you get negative slippage. But if you start missing many trades and start trying to guess winners and losers you will fail. By forcing you to enter trades not taken I am trying to get you in the habit of always taking all trades no matter what.
OK now let’s look at “bottom line” of this same spread sheet starting at line 500: (click image to enlarge)

(click image to enlarge)
Note some of the information on this “bottom line”: The green figure of $10 in column D is the round turn commissions I pay, per trade, regardless of the number of shares I trade. The green figure of (1,355) is the total dollar loss, including commissions. I have made 38 trades shown under “Hits” in column D.
In column L and M we see that during these 38 trades the system has lost $927 whereas in real time I have lost $975. That means my total negative slippage is $48 (column O). Column I tells me I have paid a total of $380 in commissions and so if I add slippage + commissions I come up with $427 total for slippage AND commissions (column O). Then if I divide this figure by the number of trades I show that I am paying total transaction costs per trade of only $ 11.26.
That is excellent and earns me an A as trader even though I am at the end of these 38 trades, still showing a loss.
But I believe that with enough practice and skill a trader can attain “trading Nirvana”, that is a trader can show positive slippage even after subtracting out commission costs. When that happens you are trading for free. In reaching for these lofty trading goals I have programmed this spread sheet to turn from red to black when this happens.
In order to show you what positive slippage looks like I took this same series of trades, but removed the first four, all of which had negative slippage. Now we are showing positive slippage, trading Nirvana: (click image to enlarge)
But you must be in front of your computers if you expect to be able to get these kinds of results. And to measure your progress you must learn to be religious about your stock trading record keeping.
Imagine a distance runner training to set a world record for 10 kilometers and training without a stop watch. If you fail to practice record keeping on a daily basis that is exactly the position you will put yourself in. You are training to become a great trader and to become wealthy. It is going to require hard work and training and you must measure your progress daily.
In order to trade this short term stock trading methodology you must learn to keep good trading records. The bottom line is that if you cannot keep good records you are not going to see good profits.
The slippage numbers are your “grade” as a trader. Profits are not your grade; your grade is the slippage numbers on these spread sheets. Work every day to improve on these numbers and your profits will follow. The system has ups and downs but CANNOT fail and will always make money over time. But you as a trader CAN fail if you miss many trades and fail to get close to positive slippage
Click below to download free my stock trading record keeping software:
The Dow closes – 290 This is what we closed out: WLDN -1000, THC -1305, CMCM -420, CSIQ -2664, RDUS +1780, AGIO +1815, DGLY -990, LCI +1435, OVAS +1950, CEMP +4815, SHAK -20, ETSY +2760, JUNO -427, RXDX +2370, ESPR -2460, ANAC +705
Total = +$8,344
This is what we are holding: (click to enlarge)
ETSY (click to enlarge)
Four Hours in (click to enlarge)
CEMP (click to enlarge)
ANAC (click to enlarge)
ADXS (click to enlarge)
The Dow closes – 65 This is what we closed out: BITA + 2430, CCIH -990, BZUN + 189, AFOP -300, DL -900, CPE +2100, CSIQ +1200, CVTI +652, DDD -460, INVN -840, GREK -240, MEG +1340, LULU -940, NBIX +165, SFUN +1170, VIPS -465, SUNE -1680, TSLA +691, ZNH -622, ADXS -15603
Total = -$13,103
This is what we are holding: (click to enlarge)
Market Open (click to enlarge)
BITA (click to enlarge)
GTN (click to enlarge)
One and 3/4 hours in (click to enlarge)
CPE (click to enlarge)
The Dow closes + 140 This is what we closed out: ADXS – 612, CEA +553, CCIH + 636, DL + 1180, GTN +7520, JRJC +247, KMX +535, ISIS -1375, GWPH -927, SFUN -135, TTPH -906, TRIL +165, VIPS +2220, TRIP +520, ZNH + 1575
Total = +$11,196
This is what we are holding: (click to enlarge)