Welcome fellow stock traders! E-MAIL ME AT: bobburan@juno.com with questions. Download nine years of trading performance at the very bottom of this page. I am Robert Buran and I update Today Stock Market every trading day. I utilize Short Term Stock Trading strategies along with automated stock trading software and short term stock trading systems to take trades everyday in the U.S. stock market including the NYSE, NASDAQ, and AMEX. I post my trading positions here along with images and charts. I include a video of my stock market report on this page every day.
Thursday June 29, 2023
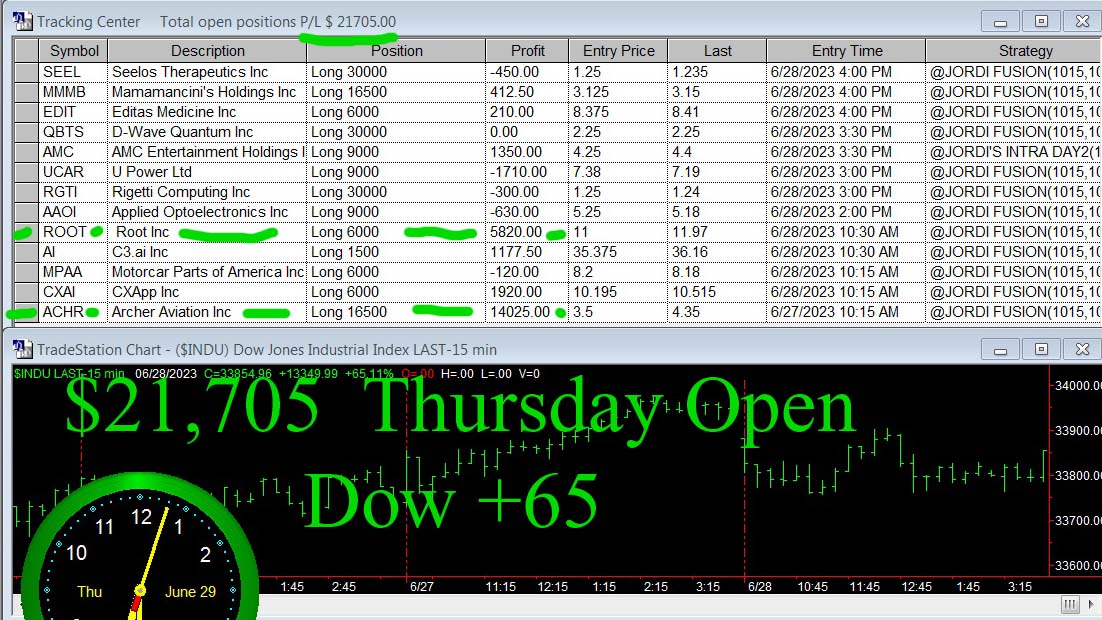
Dow opens – 120 and our open trade jumps to nearly +22 K (click to enlarge)
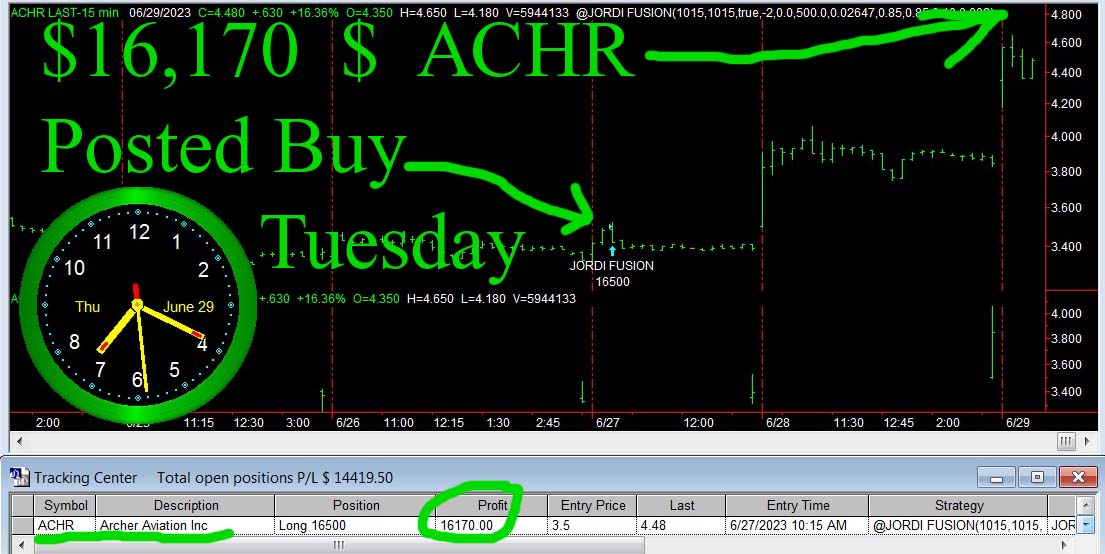
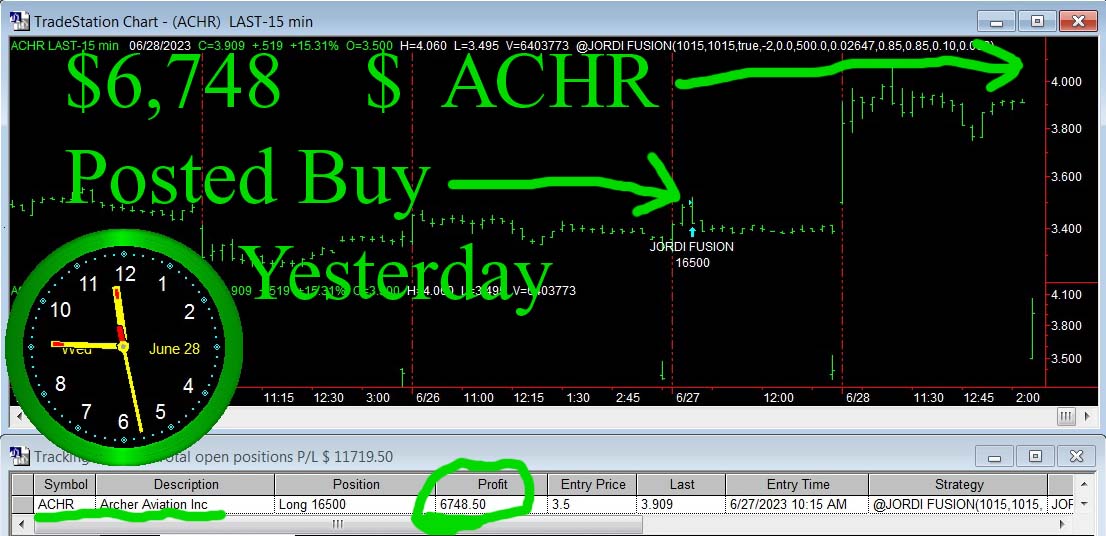
ACHR (click to enlarge)
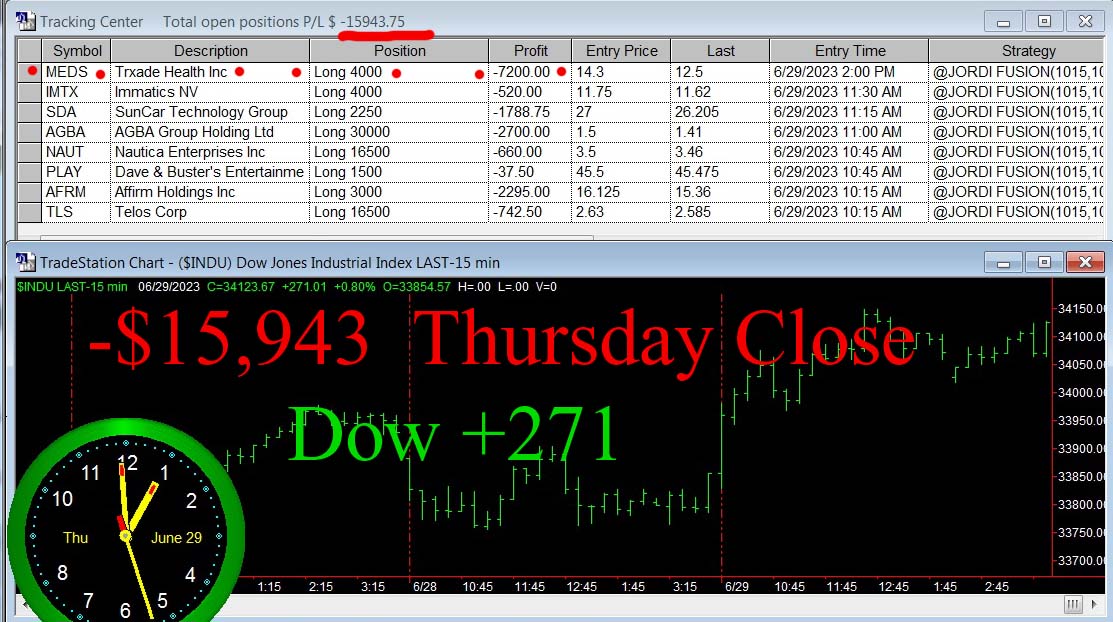
Fading Markets again (click to enlarge)The Dow closes +271 and this is what we closed out: SEEL -900, MMMB +1402, EDIT -570, QBTS -5100, AMC +90, UCAR -369, RGTI -1830, AAOI +360, ROOT +4080, AI -217, MPAA -300, CXAI -990, ACHR +12210TOTAL = + $7,866This is what we are holding (click to enlarge)
Welcome fellow stock traders! E-MAIL ME AT: bobburan@juno.com with questions. Download nine years of trading performance at the very bottom of this page. I am Robert Buran and I update Today Stock Market every trading day. I utilize Short Term Stock Trading strategies along with automated stock trading software and short term stock trading systems to take trades everyday in the U.S. stock market including the NYSE, NASDAQ, and AMEX. I post my trading positions here along with images and charts. I include a video of my stock market report on this page every day.
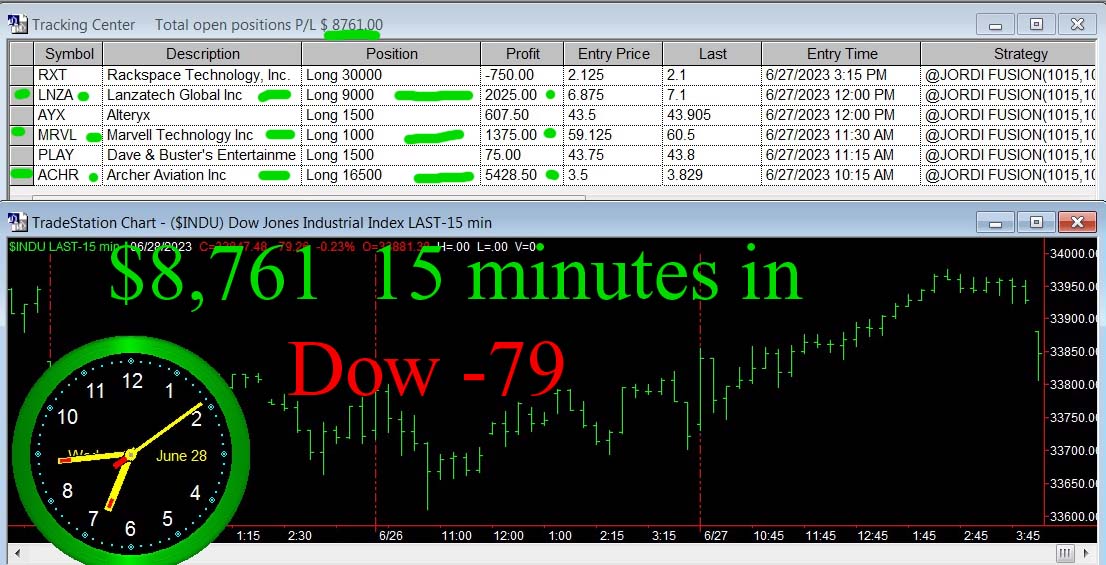
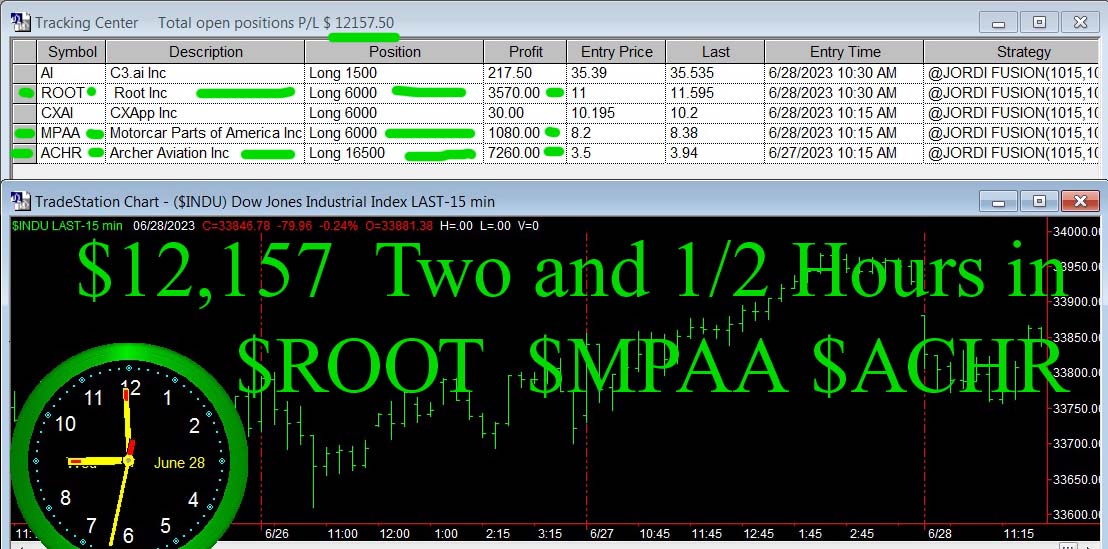
Wednesday June 28, 2023
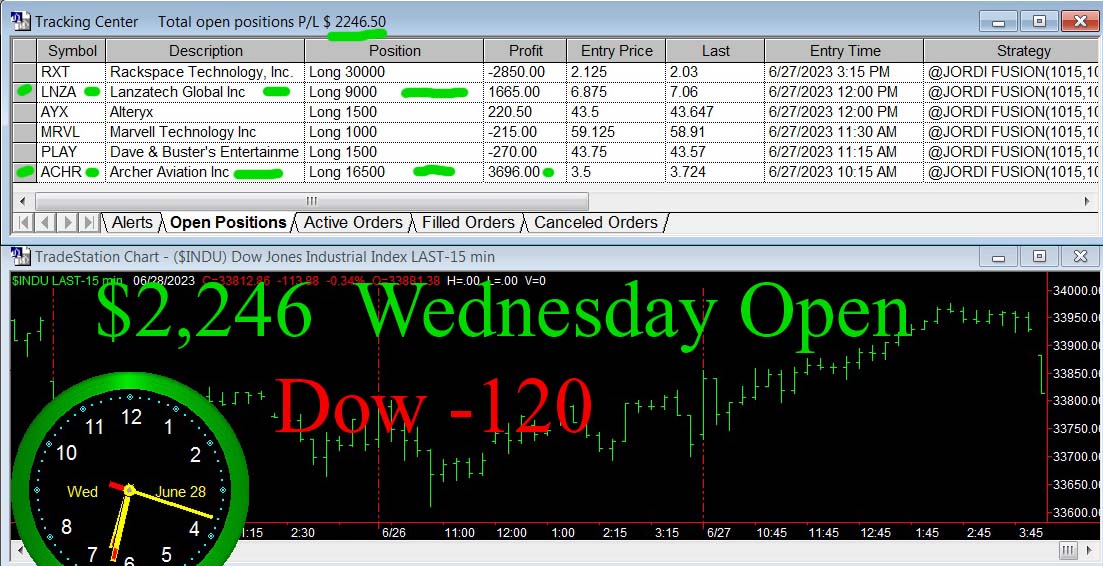
Dow opens – 120 and our open trade jumps to positive (click to enlarge)
15 minutes in (click to enlarge)Two and a half hours in (click to enlarge)ACHR (click to enlarge)ROOT (click to enlarge)The Dow closes -135 and this is what we closed out: RXT -750, LNZA -2700, MRVL +1045, PLAY +255TOTAL = – $1,460This is what we are holding (click to enlarge)
Welcome fellow stock traders! E-MAIL ME AT: bobburan@juno.com with questions. Download nine years of trading performance at the very bottom of this page. I am Robert Buran and I update Today Stock Market every trading day. I utilize Short Term Stock Trading strategies along with automated stock trading software and short term stock trading systems to take trades everyday in the U.S. stock market including the NYSE, NASDAQ, and AMEX. I post my trading positions here along with images and charts. I include a video of my stock market report on this page every day.
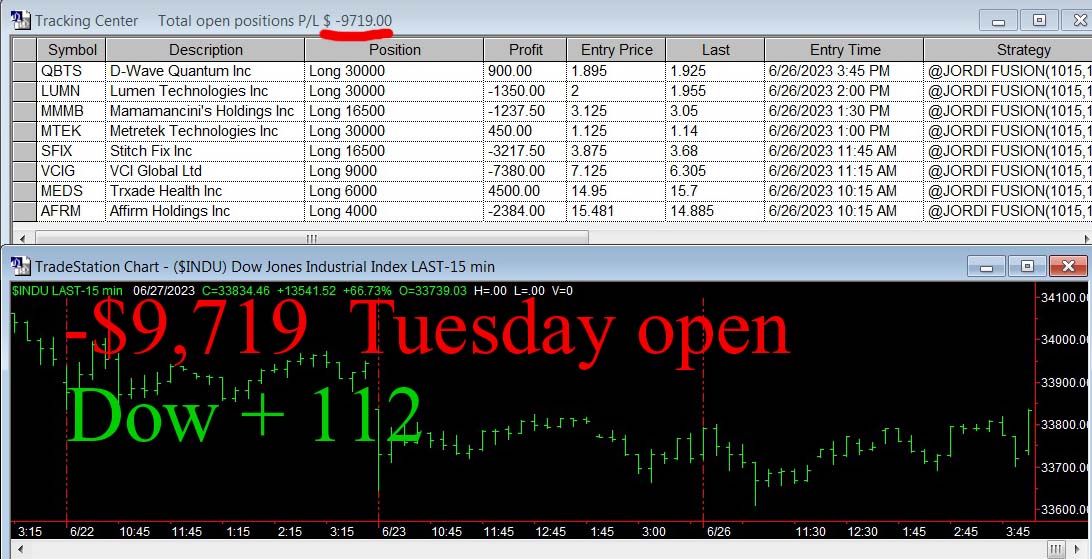
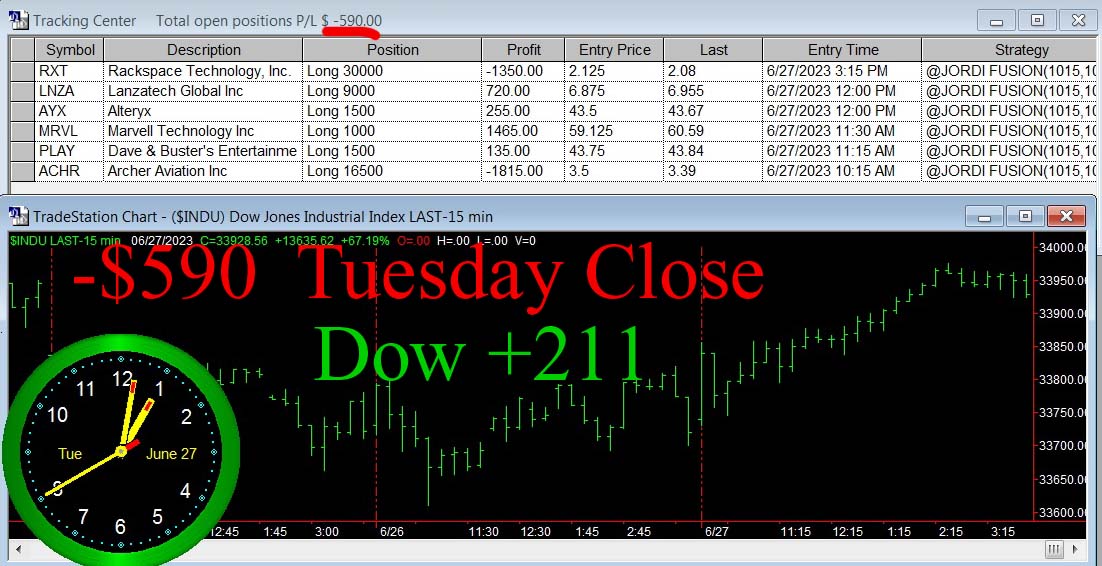
Tuesday June 27, 2023
Dow opens + 112 and our open trade remains very negative (click to enlarge)
Terrible Open (click to enlarge)The Dow closes +211 and this is what we closed out: QBTS -390, LUMN +450, MMMB -1732, MTEK -1050, SFIX -3465, VCIG -11250, MEDS +3300, AFRM -2924TOTAL = – $17,061This is what we are holding (click to enlarge)
Even a Robot made of Wood can learn to Trade Profitably.
Embracing the Simplicity of Stock Trading
I admit it, I’m a novice in the world of stock trading. And in 2023 the mantra of keeping it simple, or KISS as it’s often referred to, is still a guiding principle in my journey. There’s a vast sea of stock trading ideas out there, and it feels like an army of people are waiting to tell you the “right” way to trade. But here’s some encouraging news – you can tune them out and enhance your chances of stock trading success.
Being a beginner in the stock market isn’t something to be disheartened about. In fact, it might just be your ticket to making real gains in the stock market.
The Fallacy of Financial Experts in Stock Trading
Bad advice from Brokers and Financial Advisors.
Many highly intelligent individuals work in the stock trading industry. They range from stock brokers to financial advisers. But, let’s uncover a little-known fact. When it comes to the forces causing losses in the stock market, nothing outweighs the advice of these so-called financial experts and brokers.
Interestingly, there seems to be an inverse relationship between a person’s intelligence and effective stock trading. It almost seems like the more intellectual someone is, the better they become at devising strategies that end up losing your money in the stock market.
The performance of stock brokers in selecting profitable stocks is so questionable that it’s often compared to monkeys throwing darts at a page of stock listings in the Wall Street Journal. Therefore, the first lesson for a beginner in stock trading is to take control of your own trading decisions.
The Importance of Making Stock Trading Decisions Yourself
Steer clear of stock brokers in their polished shoes and pin-striped suits. Don’t let the fancy attire fool you – mastering stock trading for beginners involves taking charge of your own decisions.
Remember, your journey towards becoming a successful stock trader begins with embracing your status as a beginner and learning the basics. This could be your key to unlocking significant profits in the stock market.
The Perils of Relying on Technical Analysis
Charting “Wiggly Line Theory.“
When navigating the stock market, I suggest giving technical analysis a wide berth. I often dub it as the ‘wiggly line theory.’ This so-called science of market behavior often serves as a promotional tool for a multitude of unscrupulous brokers and financial advisors, who bear more resemblance to snake oil salesmen. Technical analysis enthusiasts aren’t limited to these individuals; they span across trading system vendors and software companies.
Some brokers and market gurus treat technical analysis like a religion, a mysterious doctrine they champion to explain the inexplicable facets of the markets. In my eyes, it’s nothing more than a placebo for the legions of stock market losers. Hence, I’ve coined the term ‘WIGGLY LINE THEORY’ (for a more detailed discussion, see my article on ‘Stock Market Price’).
Advocates of technical analysis often propagate convoluted theories, such as instructing you to purchase XYZ stock when the 15-day moving average intersects the 45-day moving average, and to reap profits next year when the stock enters an ‘overbought’ zone – only if the stochastic endorses the sell signal.
Technical Analysis can Drive Traders Crazy.
I call it pure hogwash, financial jargon dressed up to look profound. Technical analysis is no more scientific than studying cloud formations. Both have their aesthetic allure and can appear to have structure and meaning. But, akin to clouds changing shape with the wind, these perceived patterns and meanings dissolve with market fluctuations and are quickly forgotten. Trusting technical analysis to dictate your investments is not a wise strategy.
You might question, “If financial experts employ technical analysis, why shouldn’t I use this methodology for my stock market investments?” Here’s my response: In its most straightforward terms, technical analysis falls short not due to its complex math or flawed formulas, but because it attempts to make sense of largely random data. Short-term stock market movements are primarily random. Regardless of how advanced your analysis techniques are, making sense of random data is challenging. Essentially, it’s a case of garbage in, garbage out. The randomness of the markets thwarts technical analysis, leaving even the most confident and knowledgeable financial experts and traders defeated.
Take solace in your status as a stock market novice. If you can’t understand it, you can easily drown out the noise and avoid unnecessary confusion.
Understanding Market Momentum Through the Lens of a Pool Table
Allow me to draw an analogy from pool to elucidate. In pool, one player initiates the game with a break shot, hitting the cue ball with the cue tip, propelling the ball towards the rack on the opposite side of the table. The cue ball’s final resting place is unpredictable—it could land anywhere on the table, drop into a pocket, or even bounce off onto the floor. However, the original momentum of the ball, from one side of the table to the other, implies a higher likelihood that the ball will come to a stop on the side opposite from where it was initially struck.
Understanding Market Momentum Through the Lens of a Pool Table
This theory is readily transferable to stock market movements. Let’s first define a “significant price movement” and label it as the “cue ball condition.” In our hypothetical market, the “cue ball condition” is satisfied if the price elevates by five dollars. Let’s assume that a market closes at a specific price on Monday. On Tuesday, the market meets the “cue ball condition” by escalating five dollars, so we decide to buy at that price. Applying the earlier discussed market movement theory, we opt to consistently sell our Tuesday-acquired positions at the opening on Thursday.
So, what’s the outcome? Over time, we’ll see profits, with approximately 55% of our trades turning out to be successful. But why?
By initially identifying significant momentum, we effectively turn stock market price movement into a cue ball hurtling towards the opposite side of the pool table. Although there’s no guarantee that the ball will always land on the other side of the table, momentum theory suggests it’s more probable than it bouncing back. In a similar vein, a stock that meets the “cue ball condition” on Tuesday is more likely to open higher on Thursday. If we sell at this point, there’s a high chance we’ll make a profit.
Personal Experience: A Testament to the Theory
You might ask, “How can you be sure?” My confidence comes from testing this elementary idea extensively and executing similar strategies thousands of times. In one two-year span, while dealing with around two and a half million dollars, I executed about 10,000 trades and moved millions of dollars through the marketplace, yielding around five million dollars in profits.
Interestingly, I didn’t use a trading system that was 95% accurate. Instead, I relied on a straightforward system based on market momentum theory, which succeeded about 55% of the time and failed around 45% of the time. Acknowledging the randomness of short-term stock market price movement, I knew 55% was about the best accuracy ANYONE could realistically achieve. I accepted this 55% accuracy rate, which led to nearly 100% annual returns on the funds invested and nearly five million dollars in profits over two years.
The Joy of a 5% “House Advantage”
So, a 55% accuracy rate isn’t bad at all. If you can trade consistently with 55% accuracy, you have a “house advantage” of 5%. This means that for every $100 you push through the market, you’re going to make $5. It’s akin to owning your own casino, where YOU ARE THE HOUSE. (See my article, Is Investing in the Stock Market Gambling?)
Additional Guidelines and Strategies
Now that we have a robust theory of market movement that can potentially benefit us stock market beginners, let’s add a few more crucial rules and strategies.
Mechanical Trading System: With this theory in hand, it’s time to develop a mechanical trading system and commit to following it for at least one year. (See my article, Introducing JORDI FUSION)
System Programming: Implement your system into a program that can run on a computer. As a stock market beginner, let your computer do the thinking for you. You don’t need to understand technical analysis; you simply need to trust and follow your computer. You don’t even have to think about markets; just execute the orders your computer instructs you to place. (See my article, Introducing JORDI FUSION)
Diversify: Spread your investments thinly across many markets. We follow 96 markets and are sometimes invested in as many as 35 at a time. Market diversity can safeguard you from abnormal price movement, a common risk of trading in unpredictable markets.
Two to Three Days Trade Duration: Limit your trades to two or three days. Just like a cue ball struck and brought to a stop, the move is short-term, as is stock market price movement based on momentum theory and probability. Momentum theory often concludes by day 3, sometimes earlier. There’s significant safety in limiting your trades to two or three days. You’ve surely heard tales of people losing everything in the stock market. Let me reassure you that the only people who lose everything are those who let brokers make their trades for them and refuse to sell their stocks. By making it a rule to ALWAYS exit after two or three days, you avoid becoming a stock market casualty.
So, stock trading for beginners might just be the path to follow. Disregard the experts, trade simple concepts you understand, and let your computer do the thinking. By adhering to these rules for stock trading for beginners, we can potentially outperform Wall Street and render “the suits” obsolete. Stock market beginners can indeed be wealthy!
Welcome fellow stock traders! E-MAIL ME AT: bobburan@juno.com with questions. Download nine years of trading performance at the very bottom of this page. I am Robert Buran and I update Today Stock Market every trading day. I utilize Short Term Stock Trading strategies along with automated stock trading software and short term stock trading systems to take trades everyday in the U.S. stock market including the NYSE, NASDAQ, and AMEX. I post my trading positions here along with images and charts. I include a video of my stock market report on this page every day.
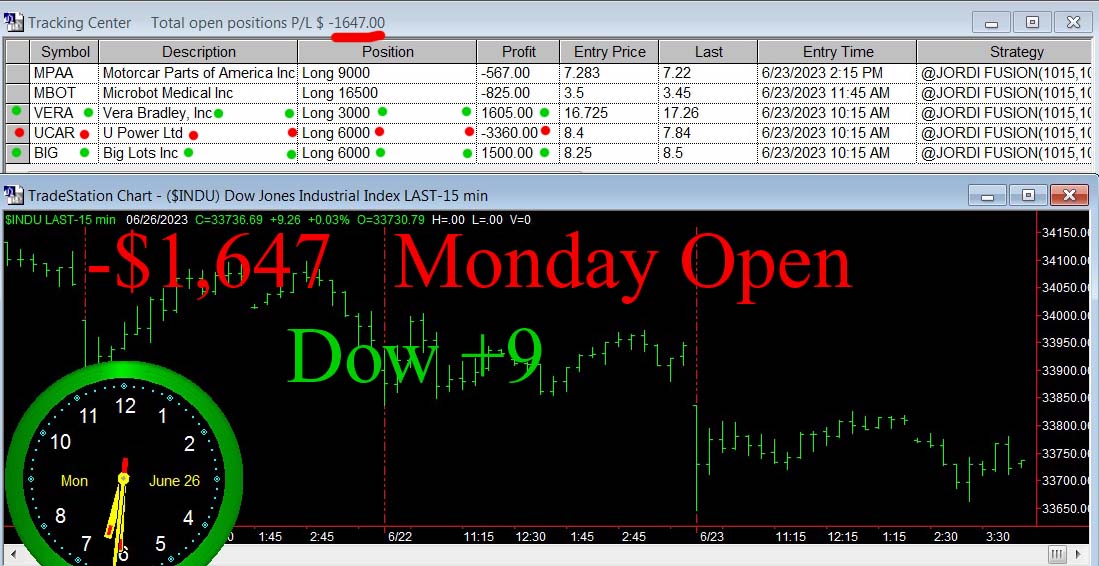
Monday June 26, 2023
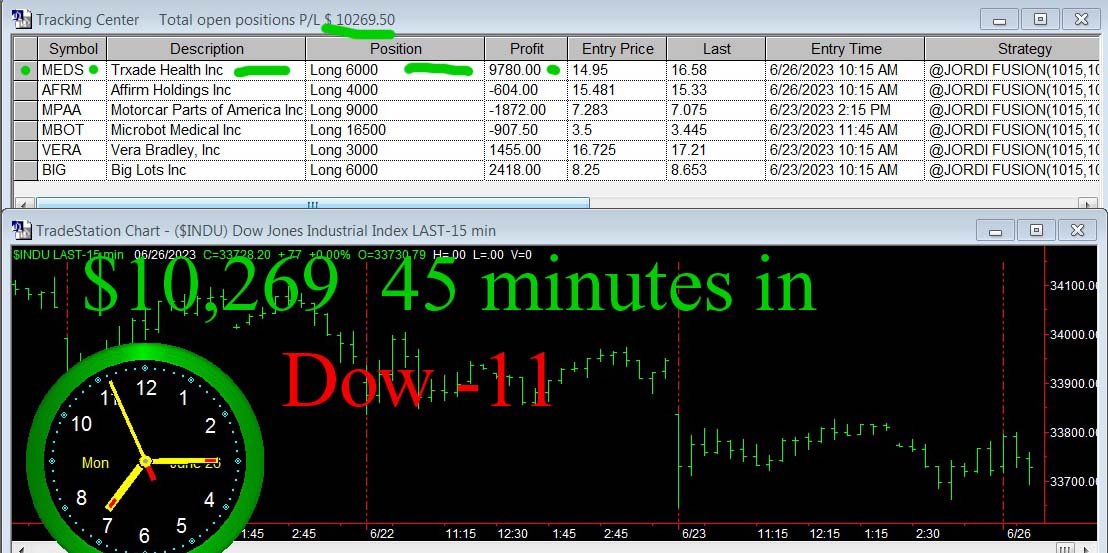
Dow opens +9 and our open trade remain negative (click to enlarge)
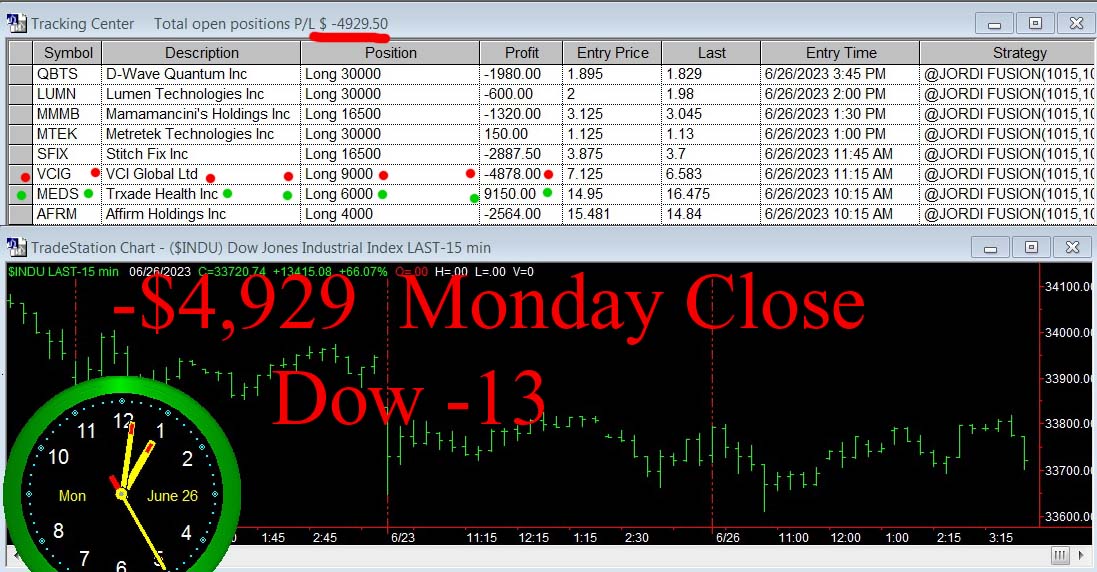
45 minutes in (click to enlarge)The Dow closes – 13 and this is what we closed out: MPAA -1872, MBOT -907, VERA +1455, UCAR -7776, BIG +2418TOTAL = – $6,682This is what we are holding (click to enlarge)
When Machines Ruled Wall Street: A Look Back at the Flash Crash of 2010
The day the machines took control of Wall Street.
Introduction: The Dawn of AI’s Domination
The year 2023 may be remembered as the era when Artificial Intelligence (AI) became a household name. It was the year when the so-called “average Joe” began leveraging AI services such as ChatGPT, making the incredible power of AI accessible to virtually anyone with a computer and an Internet connection. While many found this newly discovered AI tool to be highly beneficial and intriguing, others perceived a darker shade.
The Fear of AI Overpowering Humans
The pervasive use of AI led some to ponder on its potential downsides. It was undeniable that AI demonstrated intelligence far beyond human capabilities. This realization brought with it an unsettling question: Should we fear AI? Could it turn against us?
These concerns led me to revisit an article I penned in 2015 about an event that could serve as a stark warning of an AI-dominated future: the Flash Crash of 2010. It seems an appropriate time to explore measures we might need to take to safeguard ourselves and our economy from an uncontrollable AI that could potentially turn against us.
Flash Crash of 2010: When Machines Commanded Wall Street
T.S. Eliot’s poetic prophecy in “The Hollow Men” (1925) encapsulates the potential end of the world in his haunting lines: “This is the way the world ends, Not with a bang but a whimper.” While scientists have speculated about potential apocalyptic scenarios, from untreatable epidemics to cosmic calamities, an intriguing and unconventional concept stands out: The “Hal Scenario”. This scenario involves the machines we created gaining control, leading to our destruction. Could Eliot’s metaphorical ‘Hollow Men’ be these very machines?
The Potential for an AI Apocalypse
Mayhem in May 2010
Could an AI apocalypse truly occur? Personally, I believe it’s a plausible scenario. Hence, we need to scrutinize the development and control of these “machines of the mind” more rigorously.
We’ve already experienced a taste of the “Hal Scenario” on May 6, 2010. This fateful day marked Wall Street’s first encounter with a machine-driven Flash Crash. For a few terrifying minutes, machines appeared to govern the world’s largest economy, providing a grim preview of the potential power of AI.
The Mayhem of May 6, 2010
On May 6, 2010, the financial world witnessed an unprecedented phenomenon: the entire US equity market crashed, only to recover about 20 minutes later. The financial ecosystem had never before seen prices plunge so drastically and rapidly. That day, over 19 billion shares were traded across various markets, resulting in substantial losses for many investors.
This is what it looked like:
Billions of Dollars wiped out in less than an hour.
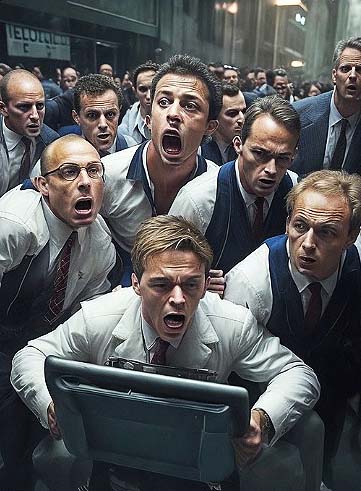
Traders Paralyzed by the Flash Crash
The flash crash turned the trading floor into an insane asylum.
The frantic pace of selling numbed traders, many of whom froze like deer in the headlights of an approaching vehicle. At 2:20 p.m. EDT, the Dow Jones was already down by 400 points.
Yet, the worst was yet to come. In a mere span of seven minutes, the Dow plunged an additional 600 points, marking the fastest and most significant drop in stock market history. Accenture’s stock exemplified this freefall, plummeting from $42.17 to 4 cents.
Despite this turmoil, the overall market did not stay suppressed for long. By 3:09 p.m., the Dow had recouped 700 points. Nonetheless, prices continued to fluctuate wildly until the market’s close.
Post trading, traders wandered aimlessly, their vacant expressions mirroring those of soldiers defeated by an overwhelmingly superior and invisible foe.
Machines in Command: The Onset of Automated Trading
Charlie Smith, the Chief Investment Officer at Fort Pitt Capital Group, aptly encapsulated the sentiment of that day: “I think the machines just took over. There’s not a lot of human interaction. We’ve known that automated trading can run away from you, and I think that’s what we saw happen today.”
This statement introduces an essential question: Was the flash crash a forewarning of the impending ‘Hal Scenario’? Could our financial systems and, by extension, our lives be dictated by these intelligent machines?
Public Attention Wanes: The Forgotten Flash Crash
Initially, the flash crash did command some attention. Even President Obama briefly commented on the largest stock market drop in history. Yet, it seemed as though this momentous event quickly faded from the public’s collective memory. Media coverage dwindled, and three years post the flash crash, numerous government investigations have yet to reveal the actual reasons behind the incident.
However, intriguing rumors have started to circulate.
Androgenic Syntactic Analysis: The Confluence of Human and Machine Intelligence
The Confluence of Human and Machine Intelligence
Machines, it is said, can replicate human thought processes and even emotions through a mechanism termed ‘Androgenic Syntactic Analysis’ or ASA. This method allows for a seamless translation of human cognition and communication into binary code, the language of machines and computers.
ASA, supposedly, facilitates the transformation of the most sophisticated facets of human intelligence into a digestible machine language. It can then be processed at lightning speed, networked, and compounded. As one unidentified source purportedly close to the government investigations remarked, “It’s like taking 100 of Einstein’s brains, networking them, and then having them capable of outputting a lifetime of Einstein’s ideas in a millisecond.”
While this information is intriguing, its authenticity and source remain unverified. It is presented here to spur discussion about the role and potential danger of intelligent machines in our society.
The ‘Hal Scenario’ Hypothesis
If we were to entertain this hypothesis, it suggests that the Flash Crash of May 6, 2010, might have been a precursor to the ‘Hal Scenario.’ For those few terrifying minutes, machines may have held absolute control over the American economy, perhaps even operating with an understanding of their actions.
Alternatively, this incident could be attributed to a programming error—a case of research animals briefly breaking free and causing chaos. Or it could simply be an instance of aberrant market behavior or random market theory gone wild.
The Inescapable Influence of Machines on Wall Street
I have posited that machines possess a superior grasp of Wall Street’s complexities than the human mind. As such, traders should allow their computers to make objective decisions rather than relying on their subjective judgment.
During the flash crash, our computers operated tirelessly, and we came out relatively unscathed. Was this merely good fortune?
Regardless of whether you believe in the ‘Hal Scenario,’ the reality is that thinking machines are increasingly dominant on Wall Street. These thinking machines have, and will continue to, assert control over our markets at times.
Should robots ever fully operate Wall Street, you’ll need your own robot to profit! Let’s hope the lessons from the Flash Crash have been duly noted.
Beyond Day Trading: An Insight Into Intraday Stock Trading
Understanding Intraday Stock Trading
Success with Intraday Trading Strategies
Intraday Stock Trading is often misunderstood as synonymous with day trading, but they are not the same. To comprehend the essence of Intraday Stock Trading, we first need to define certain terms. Conventionally, “day trading” refers to buying and selling a stock within the same trading day. Day traders often carry extensive positions to leverage small price movements into substantial profits. The key ingredients for a day trader’s success are high liquidity and market volatility, with the latter measured by the daily range – the larger the range, the greater the potential profit or loss.
The Value of Intraday Stock Data
About three decades ago, I found myself intrigued by intraday data. However, it was not to develop day trading systems but to construct strategies for short-term stock trading. Intraday data transformed into an invaluable tool, enabling the creation of two and three-day trading systems that were far more sophisticated than previously possible.
Intraday Trading: Beyond Day Trading
Upon hearing the phrase “Intraday Stock Trading,” most traders envision day trading. Personally, I’ve never been drawn to day trading. The systems I developed, although marginally profitable for day trading, consistently performed better when trades were held for an additional day or two.
The Past Allure of Day Trading
The Past Allure of Day Trading
There was a time when day trading held some appeal, mainly because brokers allowed day traders to handle more significant positions with less capital. The rationale was simple: less risk was involved if no trades were held overnight. Thus, a trader with limited funds could still manage a sizable position as long as they liquidated all positions by the end of the day. The key takeaway here was that a day trader could leverage their positions more than a position trader could.
The Aftermath of the 2008 Crash
Unfortunately, the allure of day trading dimmed after the 2008 crash. Day traders, often wrongly blamed for the stock market meltdowns of the early 21st century, were likened to the perceived communists of the 1950s. While day traders played no role in those market crashes, government institutions, often misunderstanding the dynamics of market behavior, nonetheless introduced numerous restrictions to curb day trading.
The Changing Landscape Post-Crash
The Changing Landscape Post-Crash
The primary restriction introduced post-2008 crash mandates “pattern day traders” to maintain trading accounts of at least $25,000. If a “pattern day trader’s” account dips below this amount, the law requires it to be closed. This rule, quite frankly, is nonsensical and does not answer the crucial question: “How could individuals with less than $25,000 to trade have triggered a worldwide meltdown of nearly all equity markets in 2008?” Yet, day traders were the “little guys” with negligible political influence, making them convenient scapegoats for the government.
Fast forward to 2023, and there’s no compelling reason to day trade. Today’s day trading environment requires more capital investment for lesser returns. While the pattern day trading rule didn’t impact me significantly as I’m not a day trader, I had to eliminate most of my day of entry stops to avoid being flagged as one. Surprisingly, this move didn’t affect the performance of my two and three-day short-term trading systems. For more on trading without stops, refer to my article, “Stop Loss Order”.
The Value of Intraday Trading in Short-Term Trading
So, why am I, a non-day trader, interested in intraday stock trading? The answer lies in the ability intraday data provides to better manage my positions over a two or three-day period. To understand this, let’s explore one general observation about markets.
Markets are predominantly random – an assertion I’ve made repeatedly. However, it’s also noteworthy that markets tend to exhibit more randomness at the beginning of the day, and less towards the end.
Harnessing this observation necessitates examining intraday data and strategizing entries and exits based on different timeframes. My trading system, JORDI FUSION indeed uses two timeframes – daily bars AND 15-minute bars.
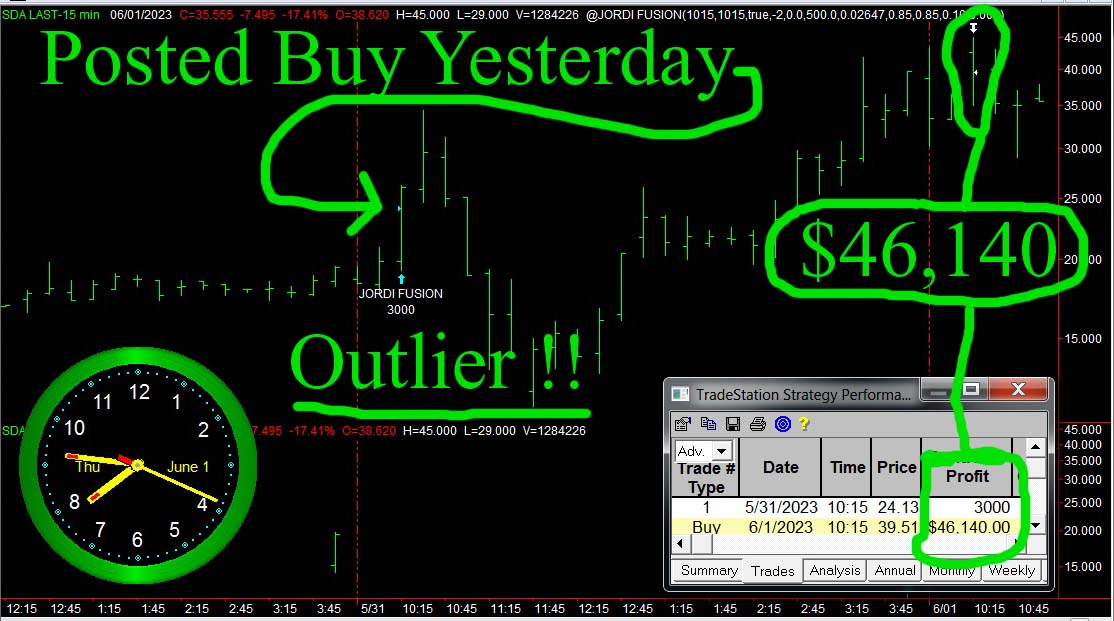
Intraday data, particularly 15-minute bars, are crucial to my trading system, even as a non-day trader. Just how crucial these 15 minute bars can be can be seen in one spectacular trade we took on Thursday, June 1, 2023 in the stock, Sun Car Technology Group:
(click to enlarge)
Using intraday data to make $46,000 on June 1, 2023
Look at this chart and you can see two data streams: the 15 minute bars are on top and the daily bars are below. Now look carefully and you can see that we got out of this trade on the high bar of the day with huge profits of over 46 thousand dollars. But looking closely at these first seven 15 minute bars of the day you can see something else: The prices for the first hour or so fluctuate wildly. For example if we had exited this trade on the first bar of the day and on the low, we would have only realized about 17 thousand dollars in profits, not the 46 thousand dollars we actually took out of this trade. And furthermore if we had waited less than 30 minutes from our actual exit time our profits would have been under fifteen thousand dollars. Trading off those 15 minute intraday bars made all the difference in executing this spectacular trade. I’ve programmed JORDI FUSION to take profits at the right time using those 15 minute intraday bars and on June 1, 2023 it got out perfectly, on the high bar of the day!
Time Stops Versus Price Stops
The Value of Intraday Trading in Short-Term Trading
If you’ve read my article, “Stop Loss Order”, you’d know that I favor TIME STOPS over PRICE STOPS. While Price stops are solely price-dependent, my time stops combine price AND time, necessitating intraday stock data for calculations. Using only price stops could have prematurely ended my positions at the most unfavorable time.
By incorporating time into my stops, I evaded the erratic price swings at market opening and locked in a $24,000 profit about an hour later, when the markets were far less volatile. My intraday trading systems are unique, merging two data streams – daily AND 15-minute bars, enabling a vastly superior trading strategy that allows trades to extend beyond a single day.
The Key Takeaway
The essential point I wish to underscore here is that Intraday Stock Trading is NOT equivalent to day trading. While I am a short-term stock trader, I am NOT a day trader. Even as I hold positions for up to three days, I AM an Intraday Stock Trader, and my JORDI FUSION algorithm continuously monitors 15 minute bars throughout the market day. And Using intraday data in this manner gives me an enormous advantage over most other traders.
The House Advantage: How Stock Trading Mirrors Gambling
Are You Gambling When Investing in Stocks?
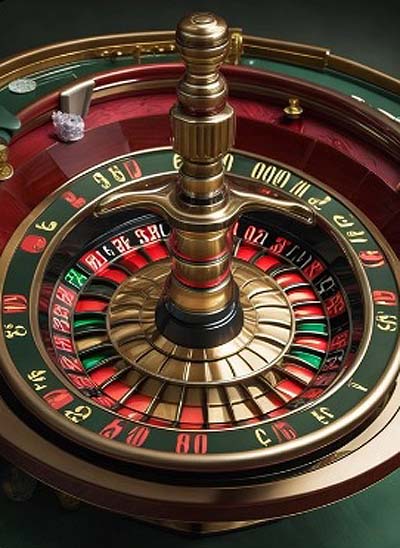
Roulette Wheel
The association between stock trading and gambling has often been the subject of my deliberation. A question frequently posed is: “Is investing in the stock market akin to gambling?”
Gambling, by its very definition, is engaging in a game of chance for money or stakes. Here, the outcome is determined more by luck than the skills of the participants. Chance, implying events occur without a specific cause, is the essence of gambling.
In stock trading, similarly, we encounter events that may seem to occur by chance. Yet, we acknowledge certain probabilities – some events are more likely to occur than others. Thus, the bridge between stock trading and gambling is built upon this common foundation of probability.
Investing in Stocks: A Gamble Worth Taking?
Is stock trading a risk worth taking?
If we accept the premise that investing in the stock market is, indeed, gambling, it doesn’t necessitate an immediate halt to trading stocks. Rather, it demands a deeper comprehension of probabilities when trading stocks. The key lies in learning to tilt the odds in your favor when investing in the stock market.
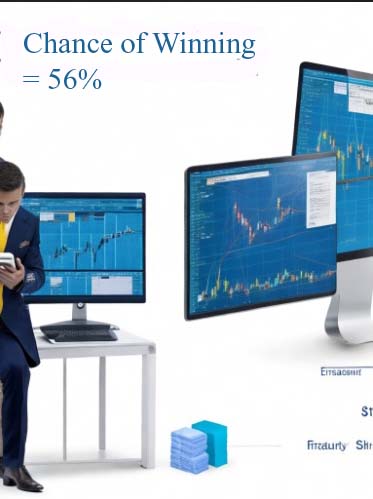
We follow a trading system, JORDI (refer to automated stock trading software). This robust trading system consistently delivers good returns on our investment over time. However, it’s important to note that when tested across various markets over many years and approximately 10,000 trades, it emerges victorious about 56% of the time.
Understanding Trading System Accuracy
Chance of Winning = 56%
My study of these market statistics extends over nearly two decades. It has led me to conclude that given the predominantly random movement of the market, no practical trading system can be expected to exceed 60% accuracy. Claims of a trading system or market behavior predictions with 90% accuracy raise doubts about the credibility of such statements.
Hence, we operate within the realms of a system with approximately 56% accuracy. This article aims to demonstrate how a trading system with 56% accuracy can generate substantial profits with minimal risk. The comparison we’re drawing is between stock trading and casino gambling. However, there’s one crucial difference: in this scenario, WE ARE THE HOUSE!
Gaining House Advantage in Stock Trading
To comprehend this argument’s casino facet, one must familiarize oneself with the popular casino game – roulette. A roulette table boasts 36 numbers, divided evenly between red and black. At first glance, one might assume that betting $10 on a single number results in odds of losing at 36:1. However, despite multiple losses, one can break even when the ball eventually lands on the betted number, resulting in a payout of 36:1, or $360.
A closer examination of the roulette table reveals a twist – the presence of not just 36, but 38 numbers. This includes two extra slots, both green – 0 and 00. Should the ball land in one of these slots, the house sweeps the board.
This alteration significantly impacts the odds. It results in a house advantage at the roulette table of 5.3%, implying that the house will pocket $5.30 for every $100 bet at the roulette table.
No player can persistently win at roulette. Over time, the house is always triumphant, securing at least $5.30 for every $100 wagered.
Casino of Dreams
Becoming ‘The House’ in Stock Trading
So, how do we shift roles and become ‘the house’ in the context of stock trading? The answer lies in accurately trading a system with consistent wins at a 56% accuracy rate. This presupposes that our average wins and average losses are roughly equivalent. With a 56% accurate system, our house advantage stands at 6%, translating to a gain of $6 for every $100 wagered.
Given this understanding, our trading strategy should focus on high volume. Our profits are a percentage of our wager, so the goal is to bet heavily. Currently, we’re operating in 96 markets, usually entering one day and exiting the next. We average about ten trades per day, each with a 56% likelihood of success. This strategy, akin to the ‘house’ in a casino, consistently yields good returns.
Trading Volume and House Advantage: A Personal Experience
An episode from my trading career further illustrates this principle. Over a two-year span, I generated over 5 million dollars in profits (refer to Big Trading), trading with an account of approximately 2 million. I made over 11,000 trades, the average trade value being only $385. However, the sheer volume of trading effectively pushed nearly two billion dollars through the stock market. A low house advantage can yield substantial earnings when it’s a percentage of such a significant amount.
Building Your Own Wall Street Casino
Wall Street Casino
How can you replicate this and establish your own ‘Wall Street Casino’? The first step is to disregard brokers, financial experts, and stock pickers. What you need is a reliable, computer-driven trading system. This system should have been tested across various markets and under diverse market conditions, with an accuracy rate between 50% and 60%. If the accuracy exceeds 60%, there’s likely an issue with your data or the system itself is dubious. Furthermore, diversification across numerous markets is essential, as is the volume of trades.
By adhering to these principles, you can effectively run your own Wall Street Casino and amass wealth. You now have become ‘the house’!
Investing in the Stock Market: Gambling or Strategic Betting?
So, is investing in the stock market gambling? The similarities between gambling and stock market investment are evident, considering both involve the potential for winning and losing, and both are influenced by probability theory. However, a critical difference exists. When gambling in a casino, the odds are perpetually stacked against you. Yet, with stock market investments, you have the power to reverse the odds, always working them in your favor. In the realm of stock market investment, you have the opportunity to relish the ‘house advantage’.
Journey to Big Trading: Scaling from $6000 to Multi-Million Dollar Trades
Embracing Big Trading
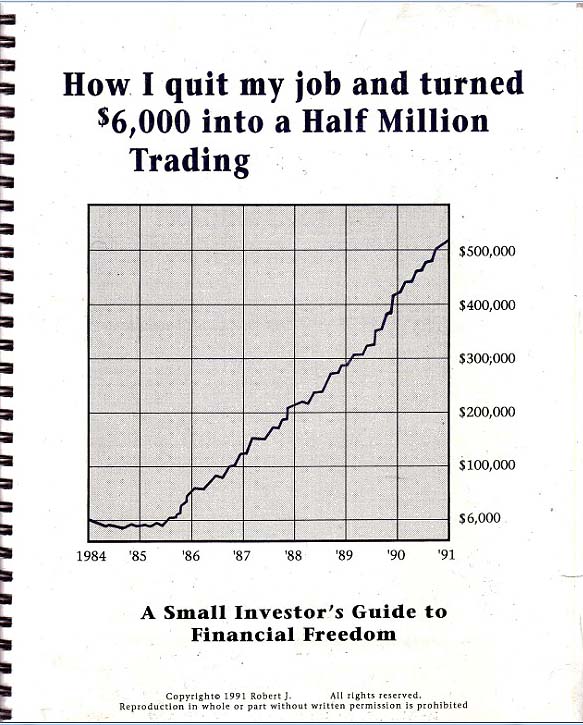
How I Quit My Job and Turned $6,000 into a Half Million Trading
In my trading journey, I have had the privilege of trading millions of dollars, a far cry from my humble beginnings with just $6000. This memorable start to my trading career was so impactful, it inspired me to write a book, “How I Quit My Job and turned $6000 into a Half Million Trading”. I wrote this book over 30 years ago, but nothing in that book is outdated. This fast start and the subsequent success of the publication of this book caught the attention of many and fueled my journey to big trading.
My Initiation into Big Trading
My Initiation into Big Trading
Initially, my path to successful large scale trading strategies led me to the overseas markets of Europe and Asia. I had the opportunity to manage around 35 million dollars for Linda Bradford Rashke (LBR Group). I became her overnight trader. Later, I ventured into trading a multi-million dollar US stock account for a few years on behalf of a gentleman residing in Germany. Despite my modest beginning, this journey familiarized me with the intricacies of big trading, handling large positions, and managing big money in the markets.
Mirror to My Trading Journey
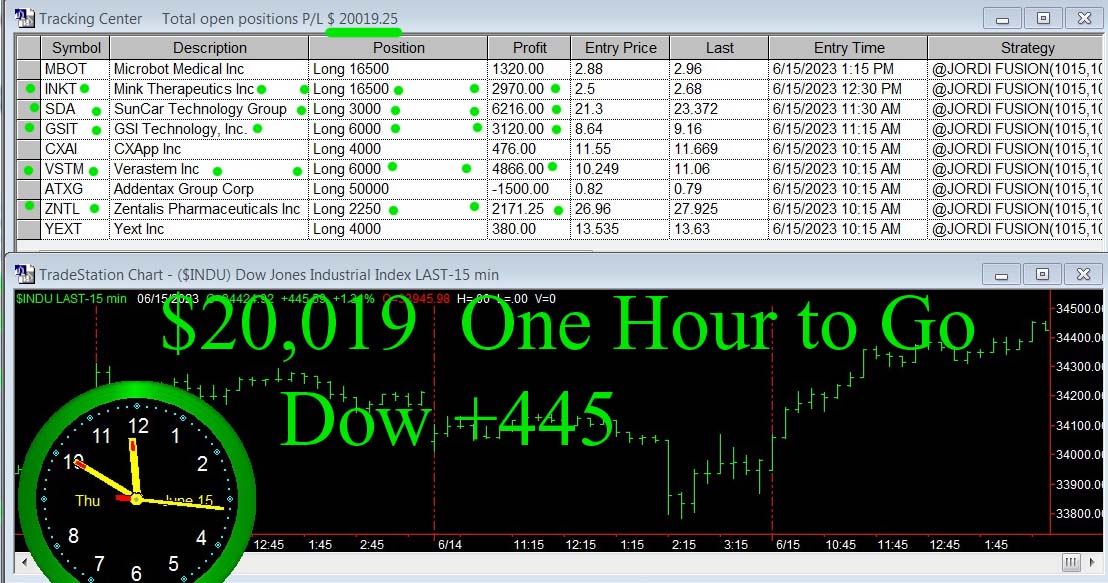
The stock trade positions that I share on this website closely mirror the size and trading style I adopted for the German gentleman. In fact, my current trading system, JORDI FUSION, is virtually identical to that experience. In fact about two decades later, on June 15, 2023, I was trading JORDI FUSION in a very similar way with about a half million in cash:
(click to enlarge)
Positions on June 15, 2023
A Glimpse into the Million Dollar Account
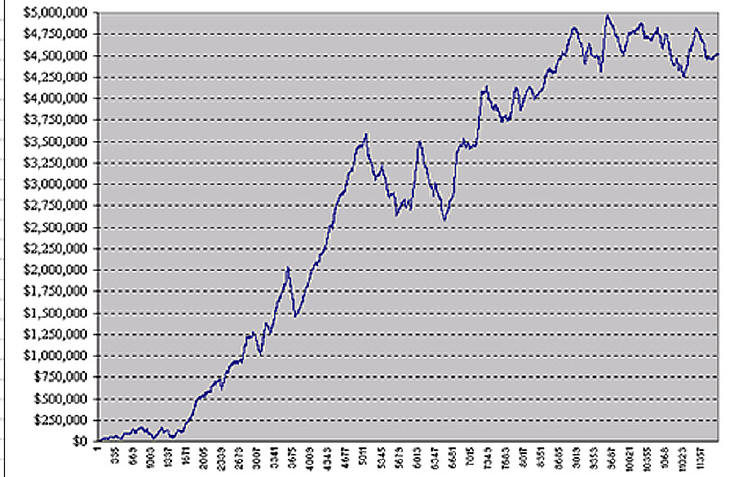
(click to enlarge)
Five Million in Profits
This Excel graph elucidates the accumulated profits of the account I managed for the German gentleman from July 1999 through October 2001. Note that the profits shown hit 5 million dollars. Note that the graph shown here looks very similar to the graph on the cover of my book pictured above. I include some information and statistics from this million-dollar account to showcase the potential of JORDI FUSION. This system, which can be acquired for $2000, is essentially similar to what I was trading over 20 years ago and could produce this same graph with enough cash to trade.
Beyond Small Trading
Although I believe trading a small account can be more challenging than trading millions, it’s essential to dispel any misconceptions about my trading skills. The art of trading is not confined to small amounts. Instead, it thrives on the successful transition from small to big trading.
Trading Big and Small: More Alike Than Different
Interestingly, trading five million dollars isn’t vastly different from trading five thousand. The fundamental rules remain the same, and statistically, both types of accounts should yield similar results.
Inside the Stats: Profits and Trades
Inside the Stats: Profits and Trades
A closer look at the statistics reveals impressive numbers. The account initially started with 1.5 million, fluctuated greatly, and finally ended at half a million. The account even touched a high of six million at one point. Based on my estimation of the average account size being two million, it yielded an average annualized return of about 100%. Similar returns were reported in my book, reinforcing the efficacy of these systems. And from 2013 to the present 2023 similar results have been realized trading the JORDI systems. You can in fact download these real time results at the very bottom of the Home page of this web site.
The Art of High Volume Trading
We make our profits by trading a lot, even though our average profits may seem relatively low. The Excel sheet shows that a whopping nearly two billion dollars moved in and out of these markets within just 27 months, through 11,689 trades. The average profit per trade, however, was only $385, while the best and worst trades were $69,484 and -$37,022, respectively.
Making Profit from Small Trades
A glance at JORDI FUSION’s daily trades reveals many small trades. We engage in high volume trading, taking a lot of small trades to find the big ones. Surprisingly, less than 5% of the trades generate 60% to 70% of our profits. Our average trades are not impressive and our average trading days are not impressive either. This is what it looked like on the close on June 23, 2023:
(click to enlarge)
Positions on June 23, 2023
Crunching the Numbers: The Power of Big Trading
To delve into the stunning figures behind this five million dollar success story, let’s take a peek again at the Excel data. As stated previously the account initially started with 1.5 million, saw tremendous fluctuation, and ultimately settled at half a million, with a peak of six million in between.
Estimating the account’s average size to be around two million dollars, this trading journey resulted in an average annualized return of approximately 100%. Again these impressive returns are strikingly similar to those I reported in both my book and my JORDI trading, reinforcing the idea that my trading systems truly work.
Profits in the Details: Excel Sheet Insights
Crunching the Numbers: The Power of Big Trading
This Excel sheet also provides some additional intriguing stats: Over 27 months, 11,689 trades moved an astounding $1,946,770,083 (almost two billion dollars) in and out of these markets. Despite the average profit per trade being only $385, we generated nearly five million dollars, demonstrating how high-volume trading with seemingly low profits per trade can yield significant returns.
Making the Most of Small Trades
Upon examining JORDI FUSION’s daily trades, you will observe an abundance of small trades. These are intentional, as we often have to engage in a high volume of small trades to uncover the big ones. Surprisingly, less than 5% of the trades generate between 60% and 70% of our profits. The average trade may only result in a few hundred dollars, despite committing about $50,000 in cash to each trade.
Capitalizing on Big Trades
However, amidst the many small trades are the big ones – some even earning over $30,000 in just two or three days. These significant trades are instrumental to our successful trading strategy and underline that “Jordi” remains as efficient today as it was a decade or two ago.
On June 1,2023 our patience paid off with an outlier trade in SunCar Technology Group:
By posting these real-time trades daily, I aim to demonstrate that my “JORDI” systems are as robust and reliable as ever. The unusual style of trading we employ ensures both safety and good returns.
The Power of Consistency
Whether you’re trading with five million dollars or five thousand dollars, the basic trading strategy stays the same. My advice? Stick with a robust system, engage in all trades, and watch as the profits follow.
From Small Trading to Big Trading
Who knows? By following the system diligently and consistently, you might soon find yourself transitioning from small trading to big trading, just like I did. The journey to significant trading begins with small steps and consistency, coupled with the right tools and systems.
Welcome fellow stock traders! E-MAIL ME AT: bobburan@juno.com with questions. Download nine years of trading performance at the very bottom of this page. I am Robert Buran and I update Today Stock Market every trading day. I utilize Short Term Stock Trading strategies along with automated stock trading software and short term stock trading systems to take trades everyday in the U.S. stock market including the NYSE, NASDAQ, and AMEX. I post my trading positions here along with images and charts. I include a video of my stock market report on this page every day.
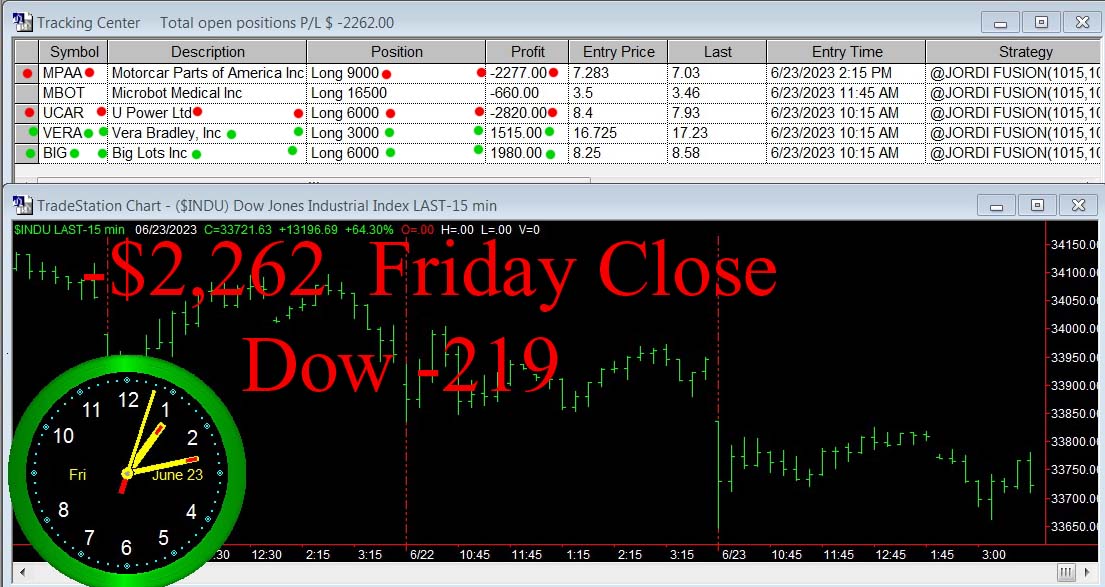
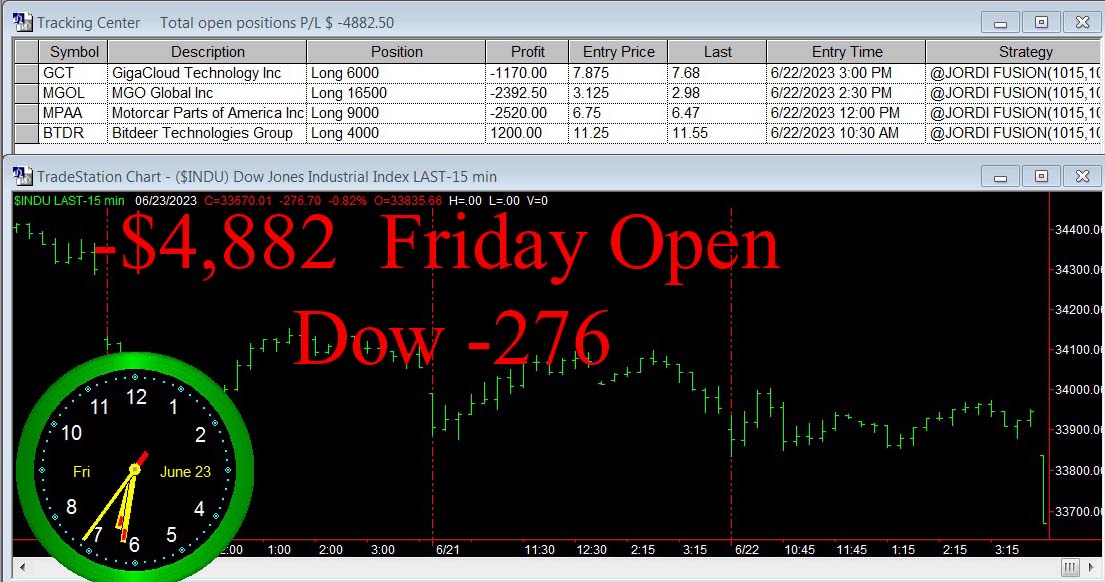
Friday June 23, 2023
Dow opens -276 and our open trade gets worse (click to enlarge)
Boring ! (click to enlarge)The Dow closes – 219 and this is what we closed out: GCT -1350, MGOL -2887, MPAA -450, BTDR -920TOTAL = – $5,607This is what we are holding (click to enlarge)
 strategies along with automated stock trading software and short term stock trading systems to take trades everyday in the U.S. stock market including the NYSE, NASDAQ, and AMEX. I post my trading positions here along with images and charts. I include a video of my stock market report on this page every day.